
README.md 3.5KB
Picadae Calibration Programs
Install
sudo dnf install python3-devel jack-audio-connection-kit-devel
prerequisites: pyyaml sounddevice soundfile pthon-rtmidi
export PYTHONPATH=${HOME}/src/picadae/control/app python p_ac.py -c p_ac.yml
Data collection
Record a sequence of notes of decreasing dynamic level
python p_ac.py # start the interactive data collection program
Capture note 60 and 61 using the full_pulseL[] and holdDutyPctD{} from the p_ac.yml
c 60 61
Plot Cheat Sheet
Print a specific pitch and take.
    python plot_seq.py p_ac.yml ~/temp/p_ac_3_of td_plot 60 2

    do_td_plot(inDir,cfg.analysisArgs, pitch, take_id )
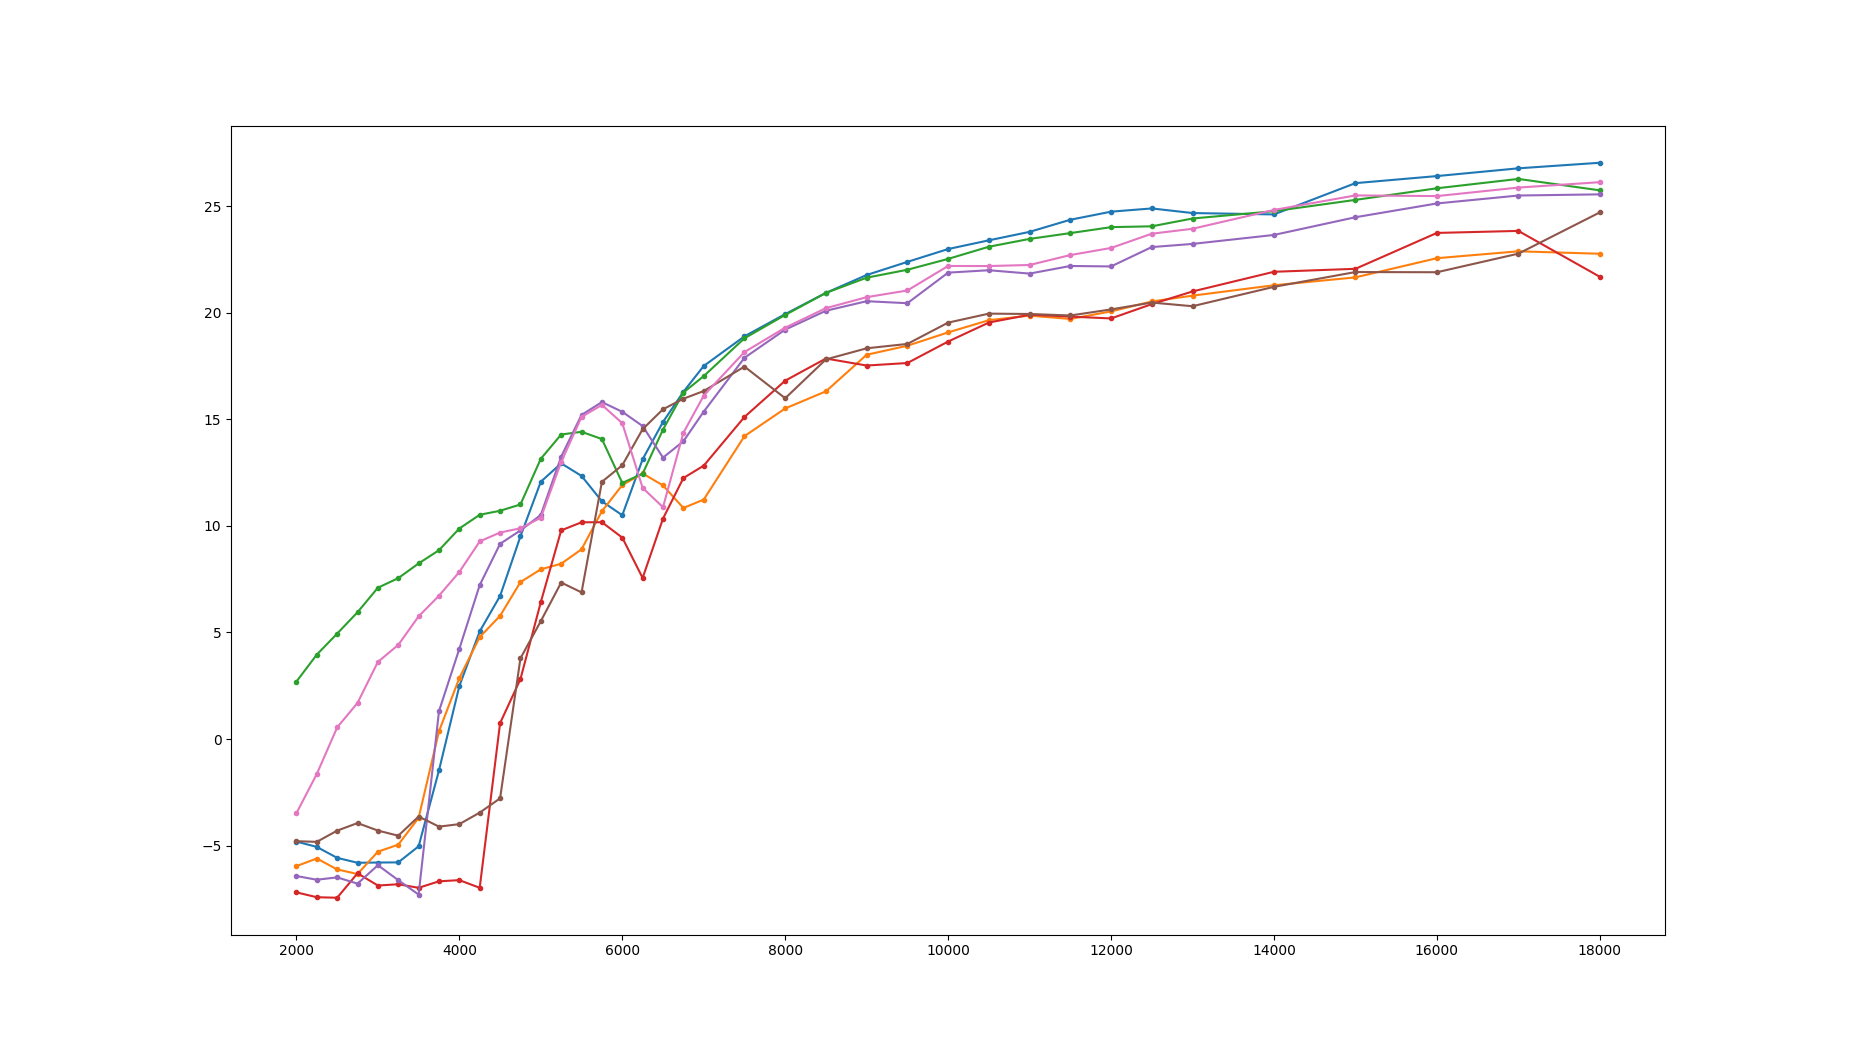
Plot all the takes for a given pitch
python plot_seq_1.py p_ac.yml ~/temp/p_ac_3_od us_db 84
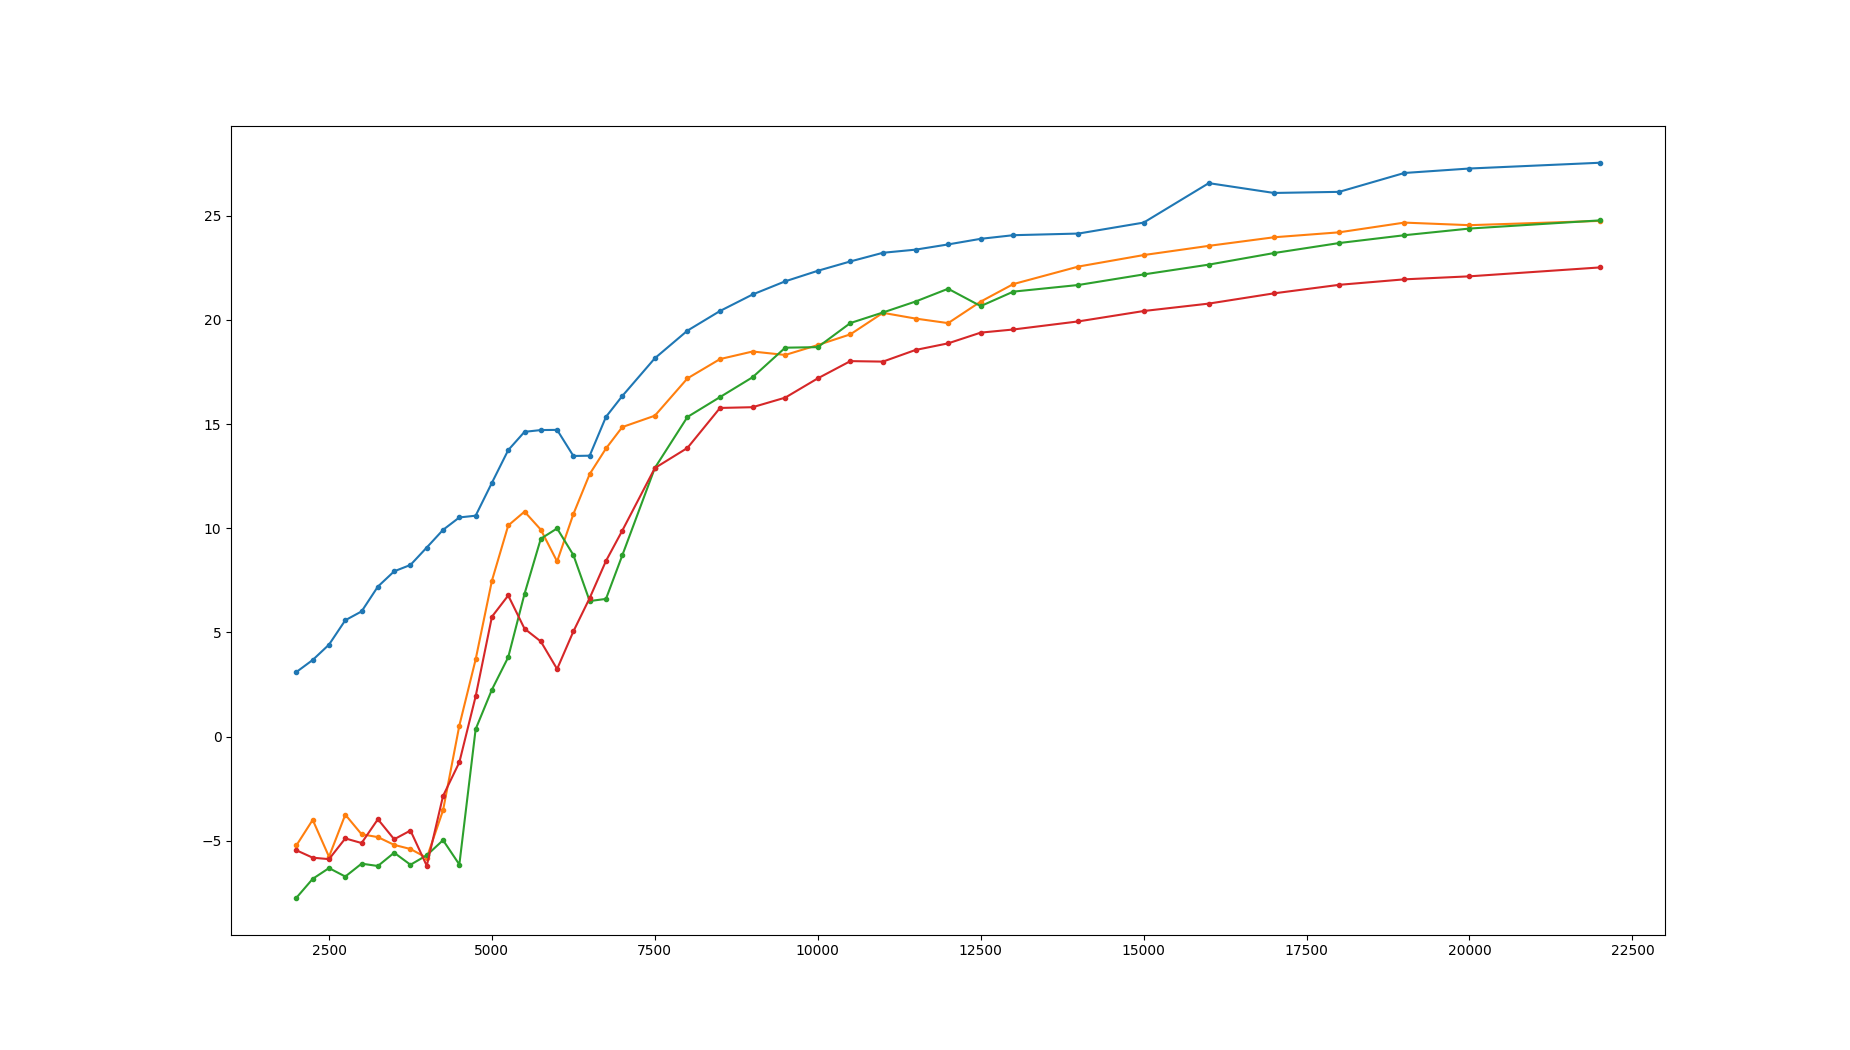
Plot a specific set of pitches and takes.
python plot_seq_1.py p_ac.yml ~/temp/p_ac_3_of us_db_pitch_take 75 0 76 0 77 0 78 0 72 10 73 1 74 1
Plot the last take from a list of pitches.
python plot_seq_1.py p_ac.yml ~/temp/p_ac_3_of us_db_pitch_last 77 78 79 80
Plot the time domain envelope for a specific set of pitches and takes.
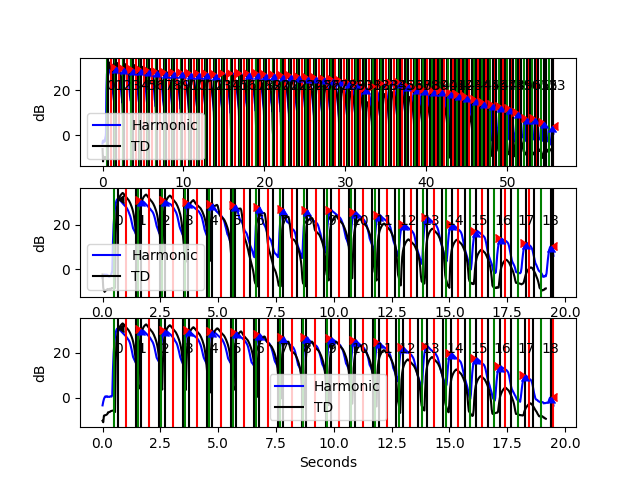
python plot_seq.py p_ac.yml ~/temp/p_ac_3_od td_multi_plot 60 3 60 4 60 5

plot_seq.py `do_td_multi_plot(inDir,cfg.analysisArgs,[(36,4), (48,2)] )
Plot the spectrum with harmonic location markers of a specific set of pitches and takes.
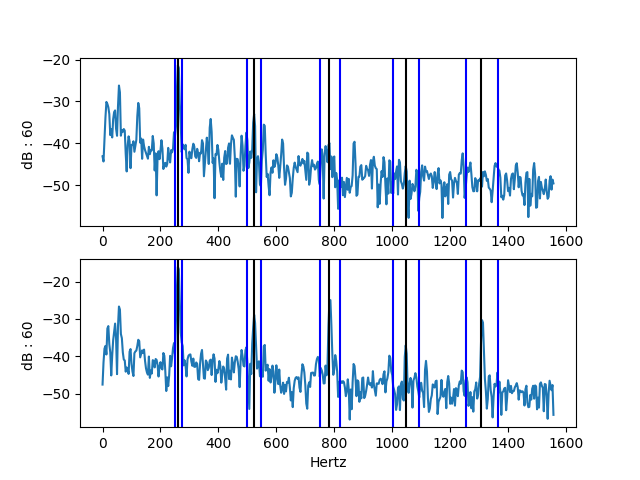
#                                                                 pitch0 takeId0 pitch1 takeId1
python plot_seq.py p_ac.yml ~/temp/p_ac_3_od plot_spectral_ranges   60      3       60      4
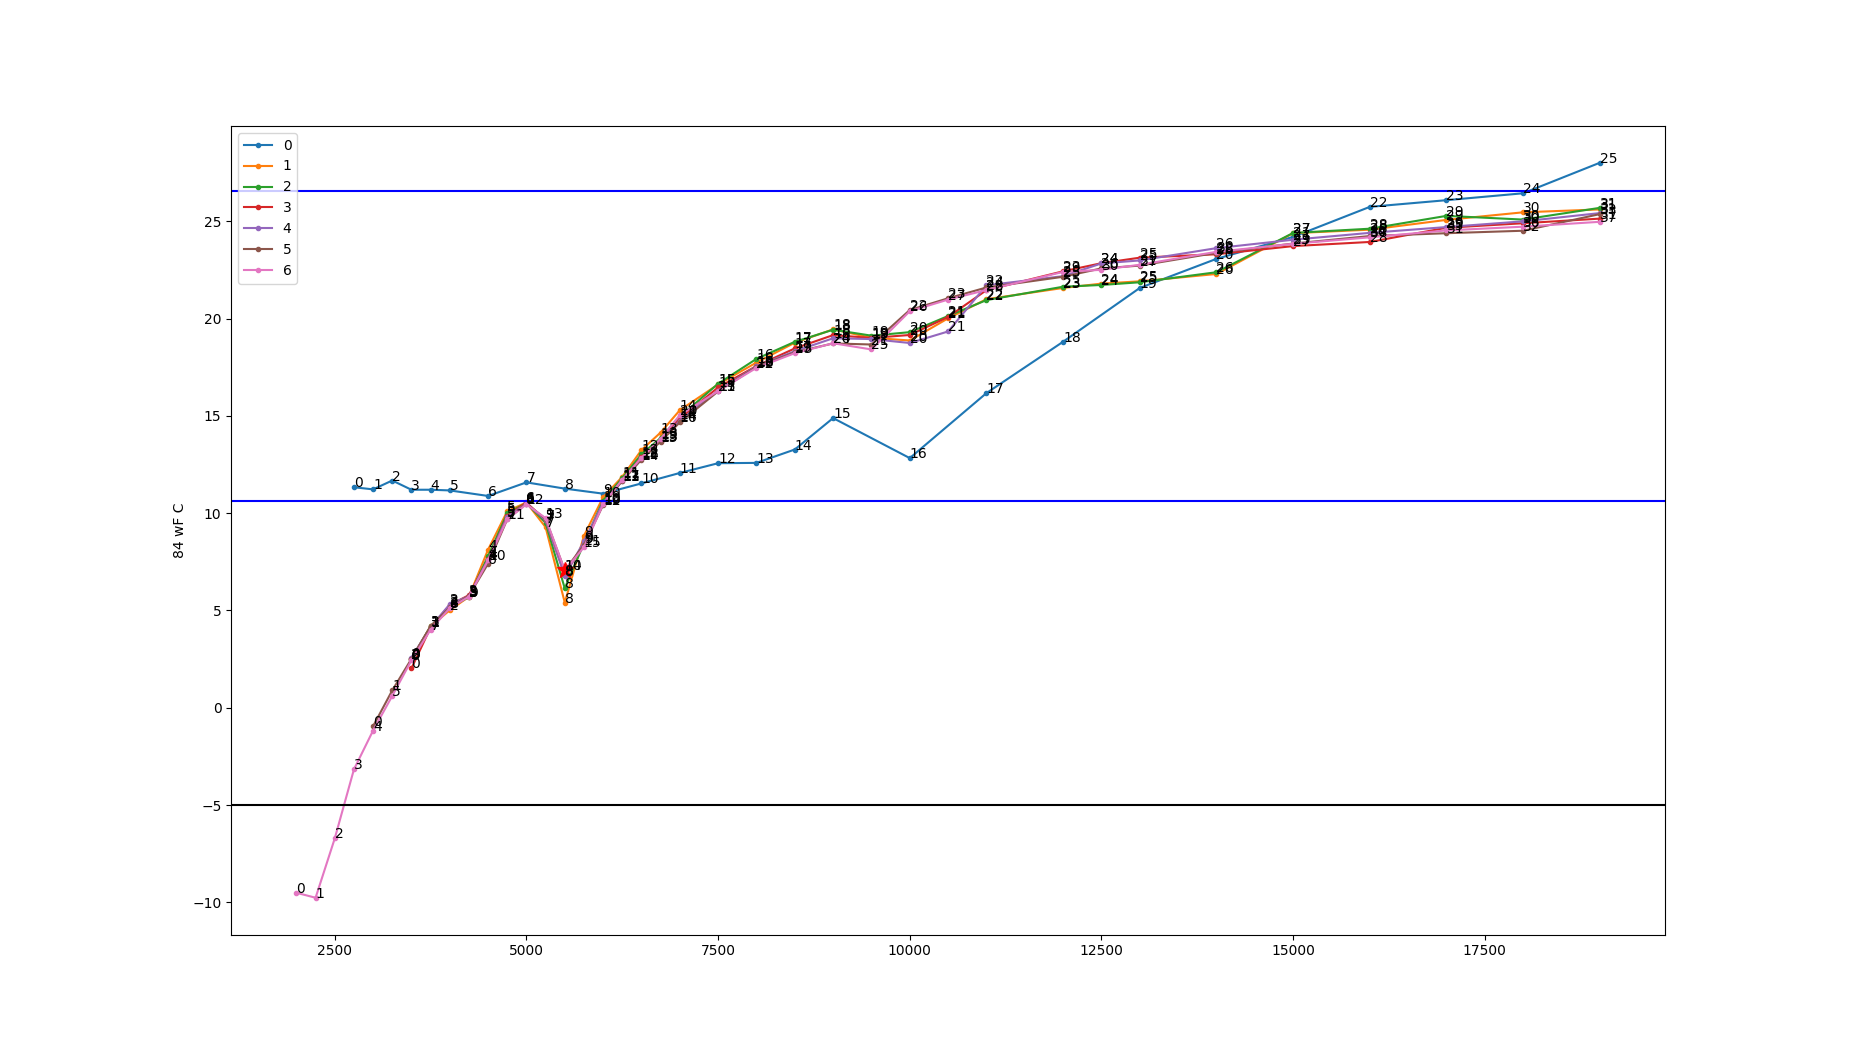
Plot the microsecond variance to achieve a given decibel value.
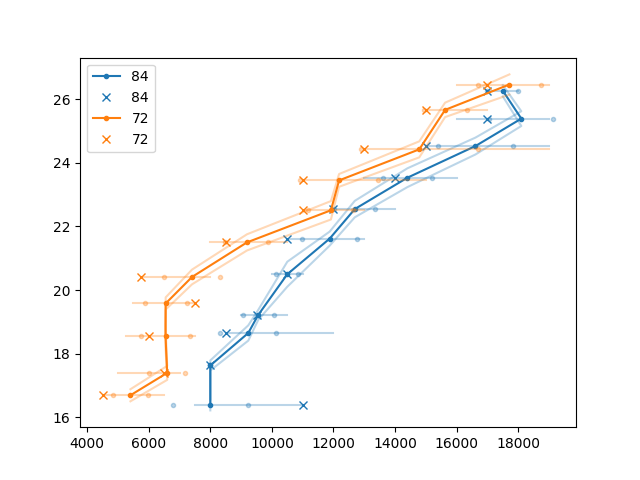
python plot_seq_1.py p_ac.yml ~/temp/p_ac_3_od us_db_map 84 72
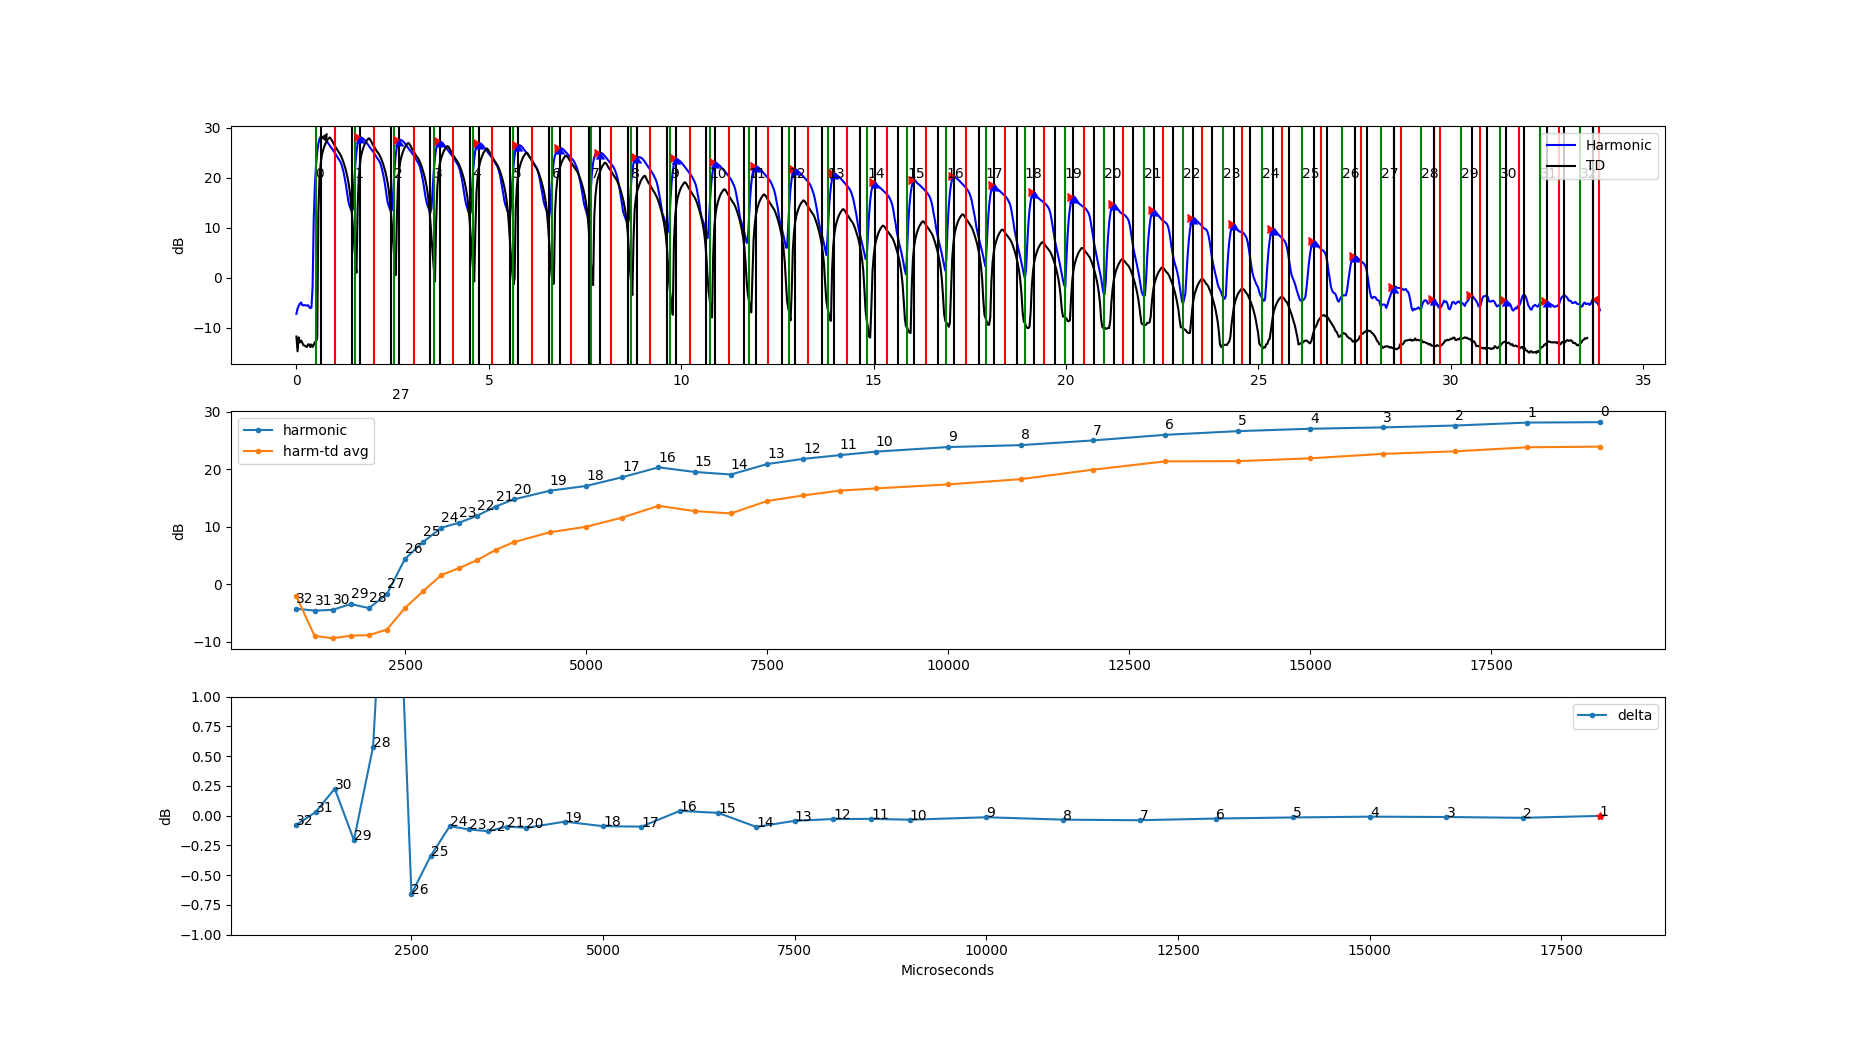
Analyze all takes for given pitch and show the mean us/db curve and places where resampling may be necessary.

python plot_seq.py p_ac.yml ~/temp/p_ac_3_of resample_pulse_times 84
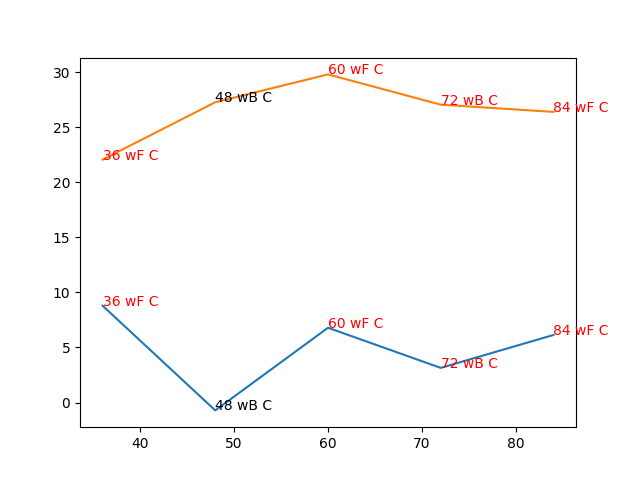
Plot the min and max decibel values for specified pitches.
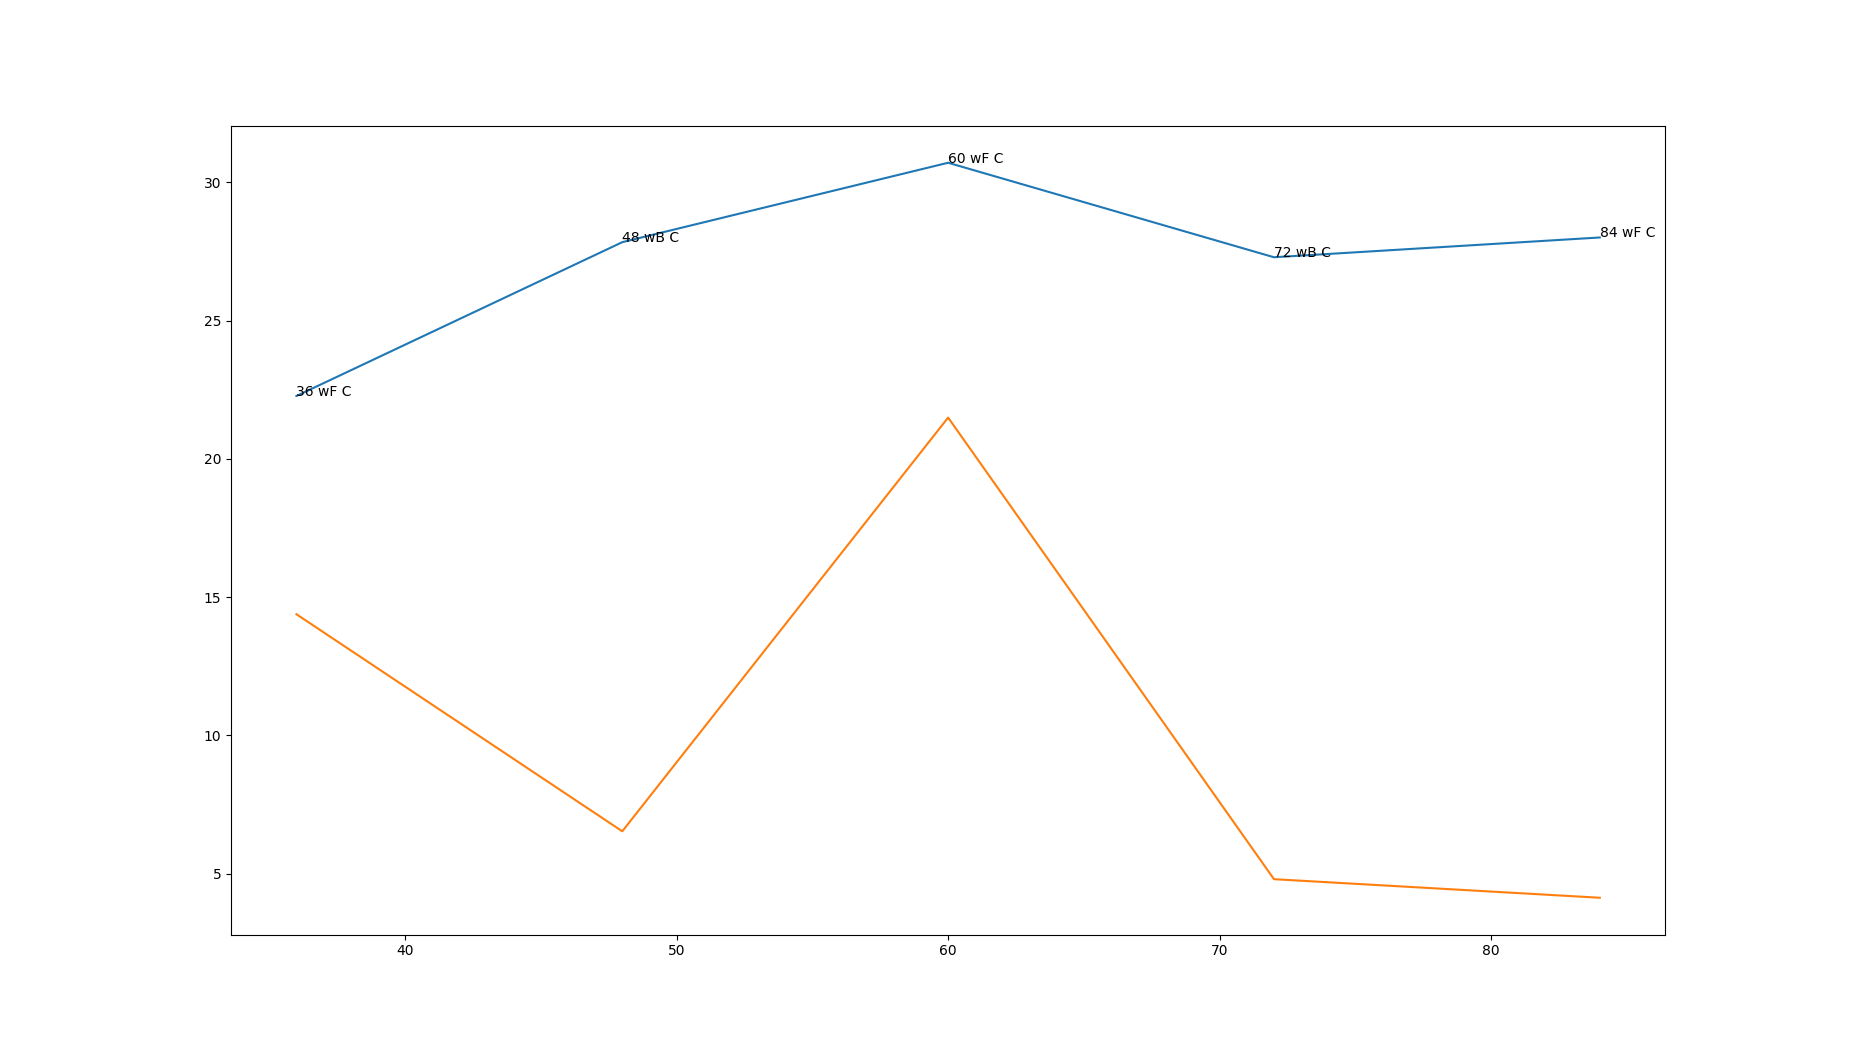
python plot_seq_1.py p_ac.yml ~/temp/p_ac_3_od min_max 36 48 60 72 84
Plot the min and max decibel values for specified pitches.
#                                                        pitch0 pitch1 pitch2 pitch3 pitch4 takeId
python plot_seq_1.py p_ac.yml ~/temp/p_ac_3_od min_max_2   36     48      60     72     84     2
Plot the min and max decibel values for specified set of manually corrected pitches.
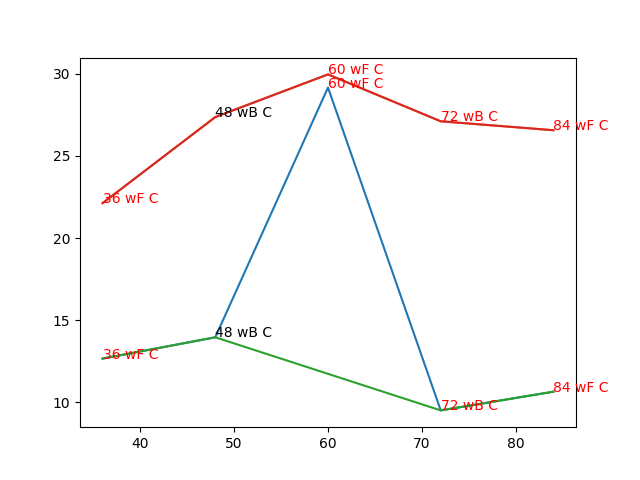
python plot_seq_1.py p_ac.yml ~/temp/p_ac_3_od manual_db
Interpolate across the min and max db values to form the min/max curves for the complete set of keys. The anchor points for the curves are taken from cfg record manuMinD,manualAnchorPitchMinDbL, and manualMaxDbL.
      # select the event (takeId, eventIdx) to use to represent the min value for each pitch
      manualMinD: {
        36: [2, 10],
        48: [2, 10],
        60: [2, 10],
        72: [2, 10],
        84: [2, 10]
        },

      # leave 60 out of the min anchor point list
      manualAnchorPitchMinDbL: [ 36,48,72,84 ],

      manualAnchorPitchMaxDbL: [ 36,48,60,72,84 ],